Trade-Off Calculator
An interactive trade-off calculator to help the LinkedIn Games team understand ecosystem impacts from notification strategy changes.
Role: Product Lead (Strategic Finance)
Skills: Data & Analytics Strategy • Internal Tooling • Tradeoff Modeling
1. Problem and Opportunity
When the LinkedIn Games team adjusted their notification mix to promote a new game, they successfully drove top-of-funnel acquisition for new and churned players, but saw an unintended decline in overall user retention. There was no existing framework or tool in place to project how changes in notification volume, targeting, or channel mix could impact broader ecosystem metrics (e.g., total player count, new user retention) prior to launch.
I recognized that we needed a tool to address this analytics gap and prevent negative shifts in the future. To solve this, I built a notification trade-off calculator. The goal was to create a self-serve, interactive dashboard that allowed Product and Engineering teams to model proposed notification changes - balancing top-of-funnel growth against retention across email, push, and in-app channels - without requiring Data Science bandwidth.
2. User Validation & Iteration
While other teams already had existing trade-off calculators, they were complex and often required Data Science validation. Working iteratively with PMs and Engineers, I identified a few key usability requirements:
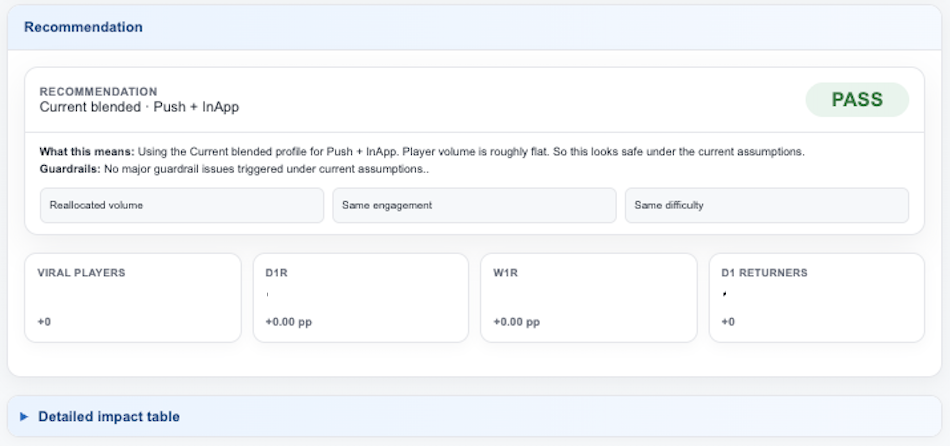
Sample recommendation based on proposed notification changes
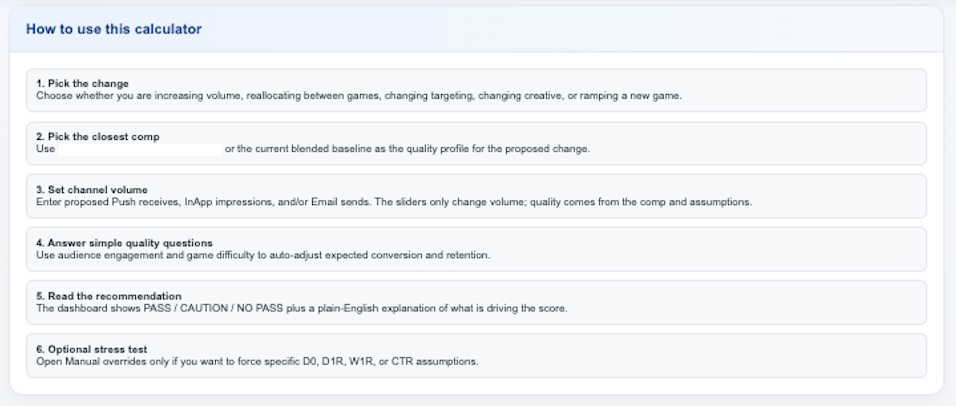
Low-Friction Input: A simple, intuitive UI that lets the user pick historical game benchmarks to pre-fill quality assumptions.
Automated Recommendations: Clear Pass/No Pass/Caution recommendation with a plain-English summary explaining key metric drivers and guardrail alerts.
Manual Stress Testing: Advanced controls allowing the user to override specific assumptions to test edge cases.
Automated Data Refreshes: Background data pipelines ensuring metrics reflect the latest available baselines without manual data pulls.
These discovery insights drove my decision to evolve an initial Google Sheets prototype into a dedicated Data App for the entire team to leverage.
3. Product Specs
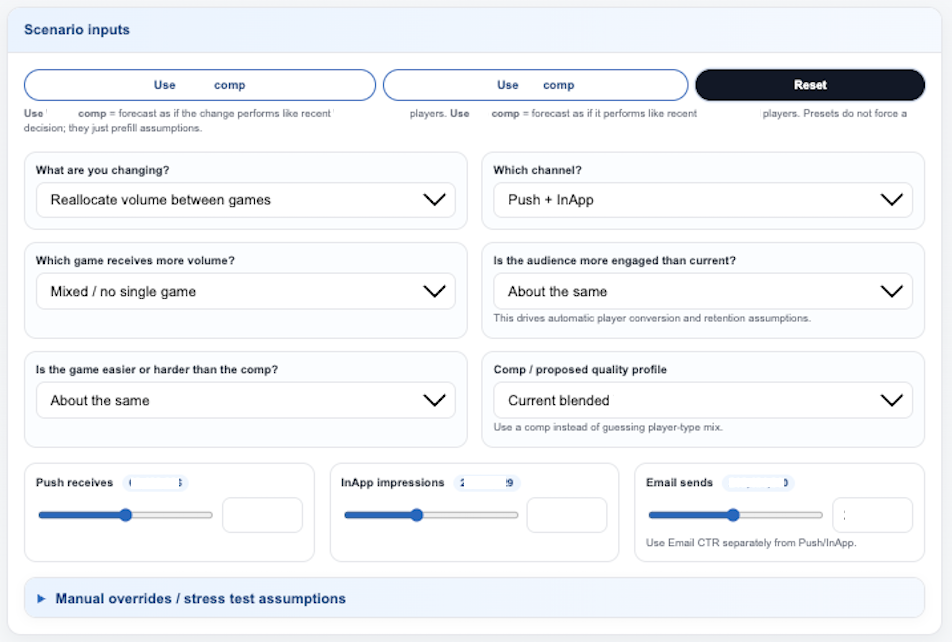
Scenario inputs and questions
Core user experience:
Guided Input Framework: Answer simple prompts regarding proposed strategy changes (e.g., volume changes, content mix shifts, targeting rules).
Interactive Adjustments: Select benchmark profiles or blended baselines to automatically make adjustments. Granular sliders also allow for more detailed adjustments.
Experiment Integration: Read experiment data to forecast whether proposed changes will drive positive net ecosystem movement, helping PMs decide whether to ramp up to a larger population.
System architecture:
To ensure reliability and performance, I designed a multi-tier data pipeline:
Scheduled notebook → Cached JSON / table outputs → Data App backend → Interactive dashboard UI
4. Success Metrics
Evaluation Time: Operational time required for the team to model and validate a notification strategy shift.
Goal: Near-instant (<15 min) feedback, replacing ad-hoc data pulls.
Pre-Ramp Validation Rate: Percentage of notification strategy proposals that are pre-validated using the tradeoff calculator prior to rollout.
Goal: 80%+.
Forecast Accuracy: Variance between predicted ecosystem trade-offs and actual post-experiment metrics.
Goal: Predictions within 10% of actual outcomes.
Net Ecosystem Protection: Prevention of unintended retention or acquisition drop-offs when notification strategy shifts.
5. Product Roadmap
Phase 1: Static Dashboard & Core UX
Initial UI layout.
Baseline metric calculations.
Manual override stress tests.
Standard for Pass/No Pass/Caution.
Proposed notification change input questions.
Phase 2: Live Baseline Refresh
Automated background data pipelines to refresh baseline metrics dynamically.
Phase 3: Comparison Reference
Auto-maintained historical data to benchmark against proposed scenarios and set quality standards.
Phase 3: Experiment Input
Integration with experiment results to pull treatment metrics automatically and model ramp-up trade-offs.
Phase 4: Persist and Share Scenarios
Ability for PMs to save, share, and compare multiple scenarios.